CO2 PPM: What does this mean?
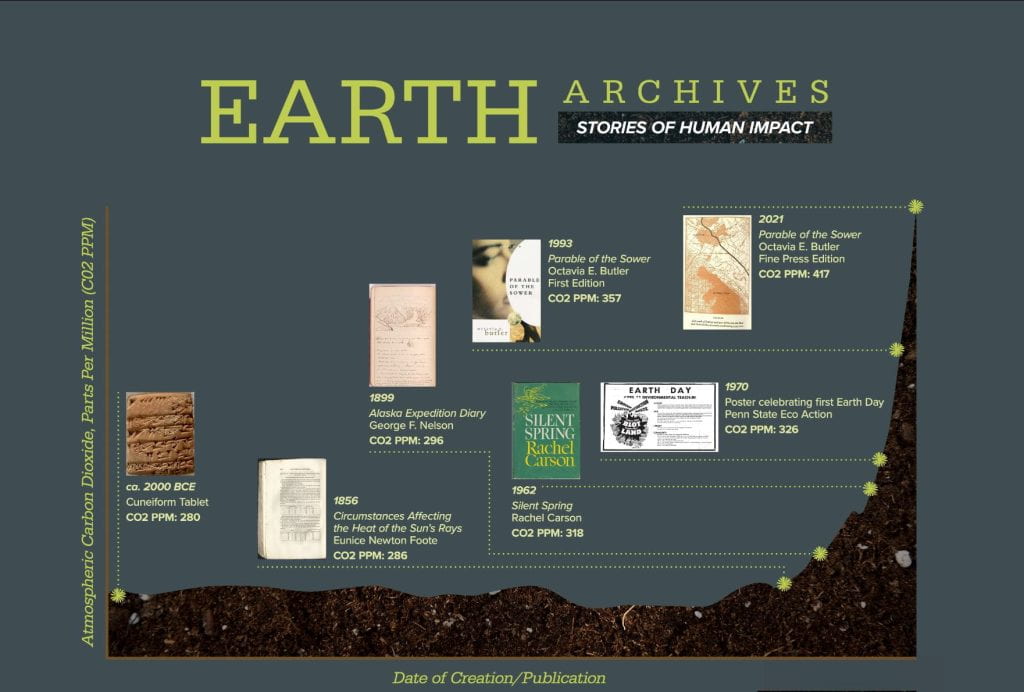
The Eberly Family Special Collections Library at Penn State University, like many other repositories of rare book and archival collections, preserves and makes accessible printed materials that span hundreds — sometimes thousands — of years. Our oldest materials, for example, are cuneiform tablets estimated to be five thousand years old. The authors of the majority of materials in our holdings, however, lived and created during a span of time when, through the combustion of fossil fuels, humans have contributed to a now unprecedented concentration of greenhouse gases in the atmosphere that is the driving factor of climate change and its impacts.
A fundamental measure of the intensity of human-induced warming can be found in the amount of carbon dioxide (CO2) in the atmosphere. Direct scientific measurement of the parts per million (PPM) of atmospheric carbon dioxide has been occurring for over 60 years, but scientists have reconstructed measurements dating back millions of years using what might be called “natural archives,” such as ice cores. Richard Alley, Evan Pugh Professor of Geosciences at Penn State, explains this much better than librarians can:
Charting CO2 data from the last 1000 years offers a striking visual explanation of the growing intensity of climate change: https://www.co2levels.org/.
At the time of this writing in April 2020, the Mauna Loa Observatory in Hawaii, which has been recording CO2 concentrations since the late 1950s, records 416 PPM of CO2. Month-to-month recordings of the measurements recorded at Mauna Loa can be found at the Keeling Curve website of the Scripps Institution of Oceanography. Though no target concentration is universally agreed upon by scientists, most public discourse has coalesced around conclusions that 350 PPM represents a safe target for the health and viability of future generations.
Given the urgency of climate change and the importance of this number, we thought it would be informative (and perhaps a little disconcerting, in a useful way) to identify the CO2 PPM found at the time of creation for many items in the exhibition. To accomplish this, we have relied on data made freely available online by the Scripps Institution of Oceanography (direct measurement, 1958-present) and the U.S. National Oceanic and Atmospheric Administration (ice core data, dating back 2,000 years). Links and citations to all data referenced can be found here: https://scripps.ucsd.edu/programs/keelingcurve/permissions-and-data-sources/.